

Stream Temperature Database Management & Story Map Final Reporting
Climate change may not exist (coughbaloneycough), but here is a dataset of fifty years’ worth of stream temperature readings in Western Montana that can be subjectively analyzed.

Trout Unlimited Floy Tag Tracking
A dashboard for the public to engage with fisheries biologists and real time scientific discovery. The tools we built allow anglers to instantly report fish that have been tagged, and the data populates a user friendly interface.

Water Rights Data Management Tools
We pushed the Data Dashboards to the limit with the complexity of this project...but despite that, it was described by Department of Ecology managers as "an elegant, significant tool with a beautiful interface." We could not imagine a higher praise for our work.

Trout Unlimited Telemetry
Romance fills the (dissolved) air as a group of telemetry tagged fish swim upstream searching for this season's soulmate, and we've built the dashboard to track and visualize their data.

Sage Grouse Partnerships in Action
A Story Map of conservation on our western rangelands, updated in 2020 to highlight new projects and new team members keeping sagebrush and sage grouse healthy.

Bat Conservation International- Story Map
The Subterranean Team at BCI needed to present to their own board about how to leverage technology for communication and data management...How about a Story Map?

Bat Conservation International- Comprehensive Data Management
We aggregated, organized, and digitized over a decade's worth of abandoned mine surveys and transformed a mile high stack of paper into a 21st century database management system: Survey 123 for collection, and Operations Dashboard for visualization and analysis.

Birch Bay Story Map – A Digital Archiving Project
Grainy photos and sepia toned faces bring us back to bygone days as we paint the picture of the last 50 years of this place through Story Map technology. 3D aquifer maps, data viz, timeline tools, and audio embedding apps bring the storytelling format into the 21st century.
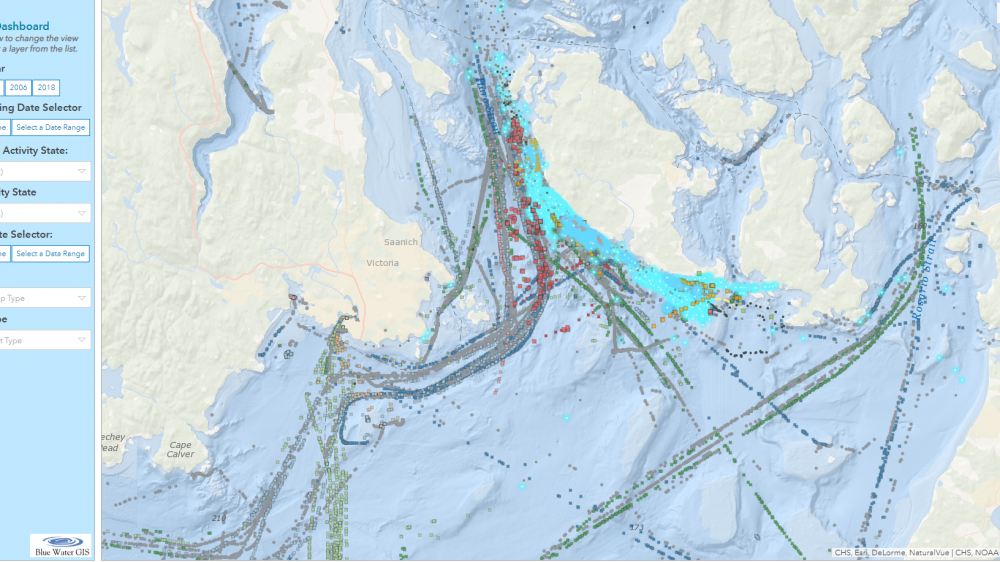
Orcas and Vessel Traffic Dashboard
Orcas in the Salish sea are rare becoming rarer, so when they are observed, the data is invaluable. This web app helps biologists visualize and analyze where these elusive creatures are and how large vessels are affecting them.
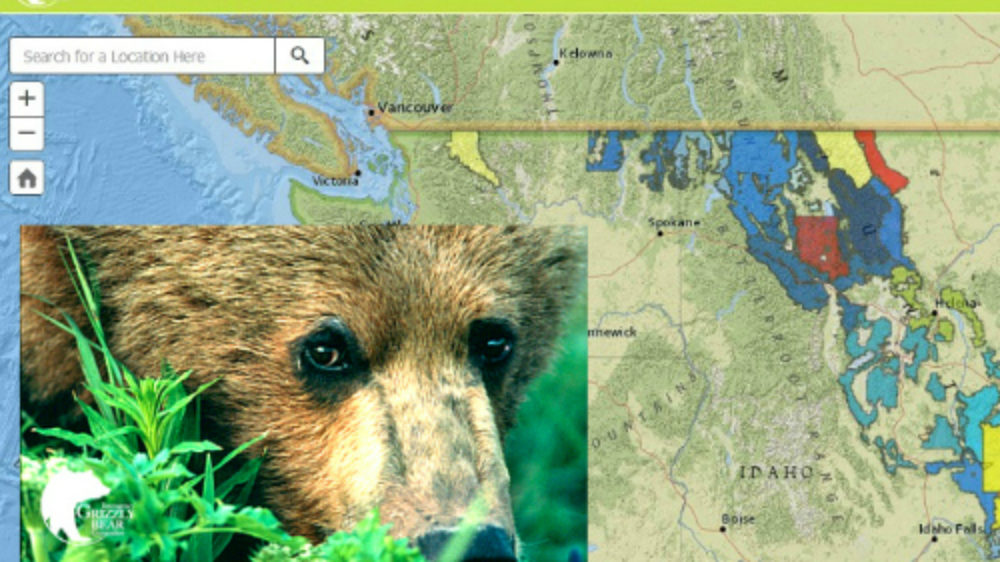
Grizzly Bear Food Storage
Not stoked about a grizzly bear tearing through your tent and devouring your sack of trail mix? Yeah, us neither. We gathered data from 25+ organizations to create a map that shows where in grizzly country food storage regulations must be followed.